A portable UV sensor with a small display
For a while now I have been paying more attention to UV forecasts in my weather app. When spending time outdoors, UV exposure is one of the things that is easy to underestimate because it does not always feel hot. On a beach day you notice the sun. While traveling, walking through a city or hiking in the mountains on a windy day, the exposure can be much higher than it feels.
The weather app’s UV forecast is useful. So is knowing that exposure is usually highest from late morning to early afternoon. But both are still fairly vague. I wanted a UV reading for the place where I am: the balcony, the beach or the mountain trail.
The UV index as it is typically reported is measured on a horizontal plane facing straight up. But shade, clouds, altitude and reflections all affect the actual value. That is why I wanted a local measurement instead of only the forecast. So I’ve looked into building a small UV monitor with a sensor and a screen. The setup is based on a LilyGO T-Display S3, a SparkFun Spectral UV Sensor AS7331 Qwiic for Arduino, a Qwiic cable and USB power. The goal, a live reading at my current location within seconds, survive being carried in backpacks and pockets and stay easy enough to use without a phone or laptop next to it.
Hardware #
Setup: the hardware is intentionally minimal and portable:
- LilyGO T-Display S3 as ESP32-S3 board and color display (1.9", 170x320 resolution)
- SparkFun Spectral UV Sensor AS7331 Qwiic for Arduino on I2C
- Qwiic cable between board and sensor
- USB power from a powerbank via USB-C

The travel case is already part of the setup. I still need a 90-degree USB-C cable so the device can be powered while it sits inside the case.
What it shows #
The device has two screens and switches between them every twelve seconds.
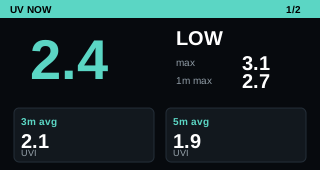
Live UVI: the first screen shows the current smoothed UVI, risk label, maximum value, maximum one-minute average and rolling three- and five-minute averages. The color follows the usual UV bands: green for low, yellow for moderate, orange for high, red for very high and purple for extreme.
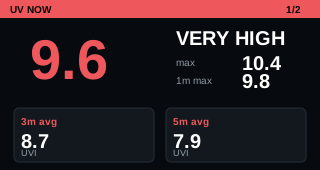
I wanted this screen to be clean and readable even in bright sunlight. Outside, the useful signal is usually whether the number is low, high and which direction it is moving.
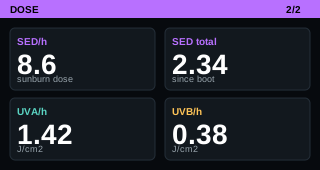
Dose: the second screen focuses on accumulated exposure. It shows SED per hour, total SED since boot and rough UVA/UVB dose rates.
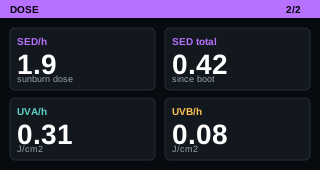
This is useful when the device runs for a longer period. A single UVI value only describes intensity at one moment. Exposure also depends on duration, so the dose screen shows the part that a live number hides. Lastly, when held at an angle, it allows to measure indirect exposure through reflection.
Calibration #
The AS7331 does not output a finished UV index value. It reports separate UVA, UVB and UVC channels and the device derives the displayed UVI from the UVB reading.
That number is a local indicator rather than an official calibrated measurement. The current conversion factor is tuned against nearby forecast values and real outdoor checks. After some testing in direct sun, I settled on an Exponential Moving Average and a conversion factor that puts the readings in the expected range without making short spikes dominate.
Data logging #
The display is the primary interface, but the device also logs readings for later analysis. Once connected to WiFi or mobile data, the ESP32 sends the current values to an endpoint on my home network. That endpoint is reachable through my VPN, so the sensor can keep its data path private instead of exposing a database or dashboard to the public internet.
The home network side writes the incoming measurements into an existing InfluxDB which already holds my air quality data. That gives me a time-series history for UVI, dose rate, accumulated exposure and the raw UVA/UVB/UVC channels. The device still works as a standalone portable meter when there is no network, but when WiFi and the VPN route are available the readings are stored automatically for later dashboards and comparisons.
Portability #
The most useful part is that the device does not need anything else once it is running. It runs flawlessly from a USB powerbank, so I can put it wherever I want to measure instead of wiring it into a fixed location.
At home, I can put it on the balcony or next to a chair outside. When traveling, I can throw it into my backpack and check it during a hiking break.
The attached display makes a huge difference as well. I do not need to open a phone, connect to WiFi or check a dashboard. The number is visible directly on the device, which is exactly what I believe will make me use this device regularly.